
Country Profile
- Country Profile
- Business and Trade
- Macro-Economic Indicators
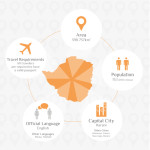
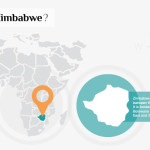
LOCATION Zimbabwe is located in Southern Africa between the Zambezi and Limpopo rivers. It is bordered by South Africa to the South, Botswana to the West, Mozambique to the East and Zambia to the North.
CAPITAL CITY Harare
OTHER MAIN CITIES Bulawayo, Mutare and Gweru
TIME ZONE +2 Hours GMT
POPULATION 12,973,808 (Census 2012)
TRAVEL REQUIREMENTS All travellers are required to have a valid passport
AREA 390,580 sq km
LANGUAGES English (Official); Shona and Ndebele
GDP per capita (2014 Jan) US$441.15
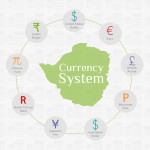
CURRENCIES Multiple currency system: United States Dollar, Euro, South African Rand, British Pound, Botswana Pula, Chinese Yuan, Japanese Yen, Australian Dollar and the Indian Rupee
WEIGHTS & MEASURES The metric system is used.
WEATHER Seasons, Weather & Suggested Clothing
December to March
Normally the rainy season with warm to hot days, mild to warm evenings. Light Clothing and rainwear.
April and May
Mainly sunny, warm days with cool to cold evenings. Pack a jersey for the evenings.
June to August
Mild, sunny days but can be distinctly cold in the evenings. A jersey or anorak is strongly recommended.
September
Pleasant sunny days – may need a jersey for the evenings.
October to December
Hot sunny days with high temperatures. Nights are warm. Light clothing.
General Note
It is recommended that sun protection and hats be worn all year round. Good sunglasses
RELIGION Christianity; Hindu and Muslim minorities. Traditional beliefs in rural areas.
Currencies
Multiple currency system: United States Dollar, Euro, South African Rand, British Pound, Botswana Pula, Chinese Yuan, Japanese Yen, Australian Dollar and the Indian Rupee
BUSINESS HOURS
Companies:
0800hrs – 1700hrs (Monday to Friday)
Banking Hours:
0800hrs – 1500hrs (Monday to Friday)
0800hrs – 1130hrs (Saturdays)
Government Offices:
0745hrs – 1645hrs (Monday to Friday)
On saturdays government offices are closed but the commercial sector opens in the morning until 12:30 pm/ 1:00 pm.
Some retail outlets opens on Sunday mornings
WEIGHTS & MEASURES
the metric system is used.
National & Public Holidays 2017
New Year’s Day January 01
Public Holiday January 02
Good Friday April 14
Easter Day April 15
Easter Sunday April 16
Easter Monday April 17
Independence Day April 18
Workers’ Day May 01
Africa Day May 25
Heroes’ Day August 14
Defence Forces Day August 15
Unity Day December 22
Christmas Day December 25
Boxing Day December 26
School Calendar 2017
1st Term: 10 January – 6 April
2nd Term: 9 May – 10 August
3rd Term: 12 September – 7 December
Many companies close for one to two weeks over the Christmas/New Year period.
Telecommunications
Zimbabwe has three cellular network operators through which roaming facilities are available. (If you wish to bring you cellular telephone along it is advisable to check with your local cellular provider as to whether or not they have roaming facilities in Zimbabwe). Pay as you go cards are also available from the cellular companies in Zimbabwe.
Access to the Sea
Although Zimbabwe is landlocked it enjoys easy access to the sea-ports of Beira and Maputo in Mozambique and Durban, Port Elizabeth and East London in South Africa.
Membership in International Trade Organisations
World Trade Organisation, Southern African Development Community, Common Market for Eastern and Southern Africa, International Monetary Fund, International Labour Organisation, United Nations, African Union, World Customs Organisation, Eastern and Southern Africa – European Union interim Economic Partnership Agreement (ESA-EU iEPA).
Regional Economic Communities
SADC
Zimbabwe is a member of the Southern African Development Community (SADC) that facilitates and co-ordinates development projects in Southern Africa. Other SADC member states are Angola, Botswana, Democratic Republic of Congo, Lesotho, Madagascar, Malawi, Mauritius, Mozambique, Namibia, Seychelles, Swaziland, South Africa, Tanzania and Zambia.
COMESA
Zimbabwe is also a member of the Common Market for East and Southern Africa (COMESA) another regional Organisation set up to encourage trade by reducing and eventually eliminating trade barriers and to create a common market. Zimbabwe and eight other countries namely Djibouti, Egypt, Kenya, Madagascar, Malawi, Mauritius, Sudan and Zambia have now formed a Free Trade Area under COMESA. Other member states are Angola, Burundi, Comoros, Democratic Republic of Congo, Eritrea, Ethiopia, Namibia, Rwanda, Seychelles, Swaziland, and Uganda.
Other
African Development Bank, World Bank, African Caribbean and Pacific States.
| Macro-Economic Indicators | ||||||
| 2010 | 2011 | 2012 | 2013 | 2014 | 2015 Est | |
| Nominal GDP (US$ bn) | 9.4 | 11.0 | 12.5 | 13.1 | 14.1 | 14.6 |
| Real GDP Growth (%) | 11.4 | 11.9 | 10.6 | 4.5 | 3.1 | 3.2 |
| Inflation (annual average %) | 3.0 | 3.5 | 3.8 | 1.63 | 0.05 | 0.00 |
| Bank Deposit (US$ bn) | 2.3 | 3.8 | 4.4 | 4.4 | 5.1 | 5.2 Est |
| Domestic credit (US$ bn) | 1.7 | 2.8 | 3.5 | 3.6 | 4.0 | 4.2 Est |
| Source: Ministry of Finance and Economic Development | ||||||
| Real GDP Growth (%) | |||||
| 2012 | 2013 | 2014 | 2015 | 2016 | |
| Act | Act | Est. | Est. | Proj. | |
| Agriculture, hunting and fishing | 7.8 | -2.6 | 23 | -3.6 | 1.8 |
| Mining and quarrying | 8 | 11.7 | -3.4 | -2.5 | 1.6 |
| Manufacturing | 5.3 | -0.6 | -5.1 | 1.6 | 2.1 |
| Electricity and water | 0.3 | 5 | 5.4 | -10.8 | 3.6 |
| Construction | 23.5 | 3.9 | 6.9 | 7 | 4.5 |
| Finance and insurance | 28 | 11.3 | 7.7 | 6 | 5 |
| Real estate | 59 | 0.7 | 4.7 | 3.9 | 2.5 |
| Distribution, hotels and restaurants | 4.3 | 3.9 | 2.5 | 4.7 | 4 |
| Transport and communication | 6.7 | 7 | 1.1 | 4.2 | 2.8 |
| Public administration | 19.1 | 3.4 | 6.3 | 1.5 | 1.3 |
| Education | 38.1 | 2.9 | 3.9 | 2.1 | 1.3 |
| Health | 7.7 | 0.5 | 1.8 | 2.1 | 2.1 |
| Domestic services | -3.5 | 6 | 2.2 | 2 | 1.8 |
| Other services | -10.7 | -4.7 | -3.3 | 3 | 2.5 |
| Less Imputed bank service charges | 9.8 | 11.3 | 4.7 | 3.7 | 5 |
| GDP at market prices | 10.6 | 4.5 | 3.8 | 1.5 | 2.7 |
| Source: Ministry of Finance and Economic Development | |||||
ZIMBABWE TRADE PERFORMANCE 2010-2016 (US$)
| YEAR | EXPORTS | IMPORTS | TRADE BALANCE |
| 2010 | 3,245,441,506 | 5,864,646,634 | (2,619,205,129) |
| 2011 | 3,557,374,988 | 8,596,194,755 | (5,038,819,766) |
| 2012 | 3,882,290,718 | 7,462,985,008 | (3,580,694,290) |
| 2013 | 3,507,296,016 | 7,704,185,950 | (4,196,889,934) |
| 2014 | 3,063,736,610 | 6,379,758,045 | (3,316,021,435) |
| 2015 | 2,705,670,015 | 6,002,514,025 | (3,296,844,010) |
| 2016 | 2,837,388,497 | 5,212,984,413 | (2,375,595,916) |
| Source: ZimStat | |||
ZIMBABWE EXPORT DESTINATIONS (2016)
| Country | % Share | Export Value US$ | |
| Total Exports | 2,837,388,497 | ||
| 1 | South Africa | 79.3 | 2,250,245,028 |
| 2 | Mozambique | 9.4 | 267,711,866 |
| 3 | United Arab Emirates | 4.1 | 116,682,893 |
| 4 | Zambia | 2.5 | 72,168,826 |
| 5 | Belgium | 1.6 | 45,698,110 |
| 6 | Botswana | 1.0 | 29,085,864 |
| 7 | Kenya | 0.4 | 11,243,971 |
| 8 | France | 0.3 | 7,350,487 |
| 9 | Namibia | 0.3 | 7,348,336 |
| 10 | Malawi | 0.1 | 4,235,285 |
| Rest of the World | 1.0 | 25,617,831 |
ZIMBABWE IMPORT SOURCES (2016)
| Country | % Share | Import Value US$ | |
| Total Imports | 5,212,984,413 | ||
| 1 | South Africa | 41.3 | 2,151,995,018 |
| 2 | Singapore | 21.4 | 1,117,928,000 |
| 3 | China | 7.0 | 365,482,400 |
| 4 | Zambia | 3.5 | 182,240,937 |
| 5 | India | 3.2 | 165,983,102 |
| 6 | Mozambique | 3.1 | 162,418,951 |
| 7 | Japan | 1.9 | 99,583,809 |
| 8 | United Kingdom | 1.8 | 91,432,300 |
| 9 | Mauritius | 1.4 | 72,169,299 |
| 10 | United States | 1.3 | 67,082,867 |
| Rest of the world | 14.1 | 736,667,730 |
ZIMBABWE MAJOR EXPORT PRODUCTS (2016)
| Product | % Share | Export Value U$ | |
| Total Exports | 2,837,388,497 | ||
| 1 | Minerals | 36.0 | 1,020,694,608 |
| 2 | Tobacco | 32.7 | 927,040,540 |
| 3 | Ores, slag and ash | 11.2 | 318,645,398 |
| 4 | Iron and steel | 4.3 | 122,519,452 |
| 5 | Sugar and sugar confectionery | 2.1 | 58,940,905 |
| 6 | Cement | 2.0 | 57,230,575 |
| 7 | Nickel and articles thereof | 1.2 | 34,975,521 |
| 8 | Raw hides and skins and leather | 1.0 | 28,960,902 |
| 9 | Cotton | 0.9 | 24,935,314 |
| 10 | Wood and articles of wood | 0.8 | 23,639,552 |
| Other | 7.7 | 219,805,730 |
ZIMBABWE MAJOR IMPORT PRODUCTS (2016)
| Product | % Share | Import Figure U$ | |
| Total Imports | 5,212,984,413 | ||
| 1 | Fuel (Unleaded Petrol & Diesel) | 28.8 | 1,501,726,037 |
| 2 | Cereals | 9.9 | 518,585,713 |
| 3 | Machinery | 9.0 | 468,141,697 |
| 4 | Motor Vehicles | 6.5 | 341,035,068 |
| 5 | Electrical machinery and equipment | 5.1 | 263,464,606 |
| 6 | Pharmaceutical products | 3.9 | 201,997,179 |
| 7 | Plastics and articles thereof | 3.5 | 181,793,555 |
| 8 | Animal or vegetable fats and oils | 3.0 | 154,623,463 |
| 9 | Iron and steel | 2.2 | 113,678,068 |
| 10 | Chemical products | 2.0 | 105,197,455 |
| Other | 26.1 | 1,362,741,572 |
Infographics